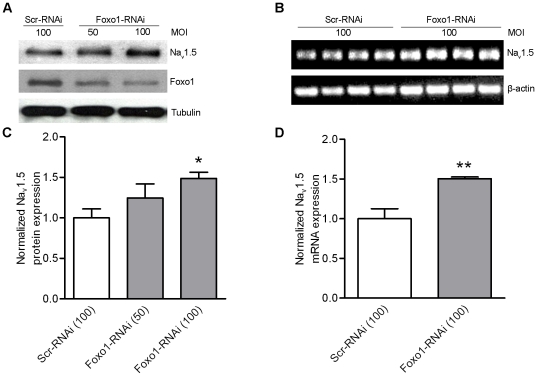
Figure 4. Silencing expression of Foxo1 increases NaV1.5 expression.
Western blots showed decrease of Foxo1 protein by 50 MOI (n = 4) and 100 MOI Adv-Foxo1 RNAi (n = 4) increased NaV1.5 protein in HL-1 cells in comparison with 100 MOI Adv-scramble RNAi (n = 4) (A) and this inhibition reached the significant difference (*p<0.05) at 100 MOI Adv-Foxo1-RNAi (C). RT-PCR showed that NaV1.5 mRNA was increased by 50 MOI Foxo1-RNAi (n = 4) in comparison with that in cells expression scramble RNAi (n = 4) (B). The values of NaV1.5 mRNA relative ß-actin between Foxo1-RANi and scramble RNAi groups were significant different (**p<0.05) (D).

