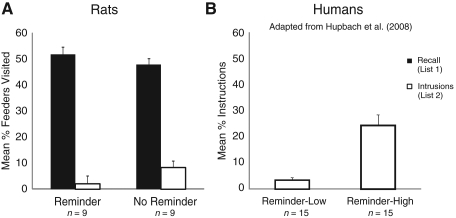
Figure 4.
Experiment 3. (A) Mean percentage of feeders visited belonging to List 1 and List 2 during recall of List 1 on Day 3 in the rat study. Error bars represent standard errors of means. Nine rats were used to obtain these data. (B) Mean percentage of objects falsely recalled from List 2 on Day 3 in the low-Intrusion and high-Intrusion Reminder groups resulting from a median split performed on the number of Intrusions in the human study. Error bars represent standard errors of means. Note: Participants were asked to recall objects from List 1. Objects that were falsely recalled from List 2 are labeled as Intrusions. Fifteen subjects participated in each group (adapted from Hupach et al. 2008).

