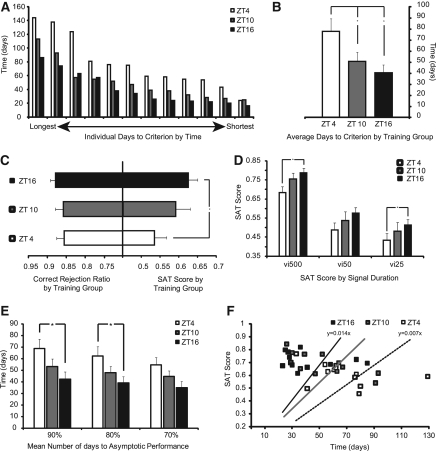
Figure 2.
Acquisition and criterion performance for Group I. (A) Days to criterion for individual animals plotted from longest to shortest for all SAT-trained animals by time of daily training (n = 36; 12 animals/group). (B) Mean days to criterion by training time ± SEM, (*) P < 0.05. Criterion performance is defined as the time needed for animals to reach 70% accuracy on nonsignal trials (correct rejections) and 70% accuracy on the longest signal duration trials (hits: 500 msec). (C) Correct rejection ratio and overall SAT score by training time ± SEM, (*) P < 0.05. SAT score provides a composite measure of performance that includes both signal and nonsignal trials across all three signal durations. A score of 0 represents chance performance or a complete lack of ability to discriminate between signal and nonsignal events, while a score of 1 represents perfect performance, with animals providing correct responses on every trial (see Materials and Methods). (D) SAT score by signal duration across all three training groups ± SEM, (*) P < 0.05. (SAT score = vigilance index [vi] at 500-msec, 50-msec, and 25-msec signal durations). (E) Mean number of days for animals to reach 90%–70% of their own asymptotic performance by group ± SEM, (*) P < 0.05. (F) Rate of acquisition relative to individual asymptotic performance. Figure plots number of days for animals to reach 90% of their asymptotic performance (x-axis) plotted against their SAT score on that date (y-axis). Slope represents the rate of acquisition for each population.

