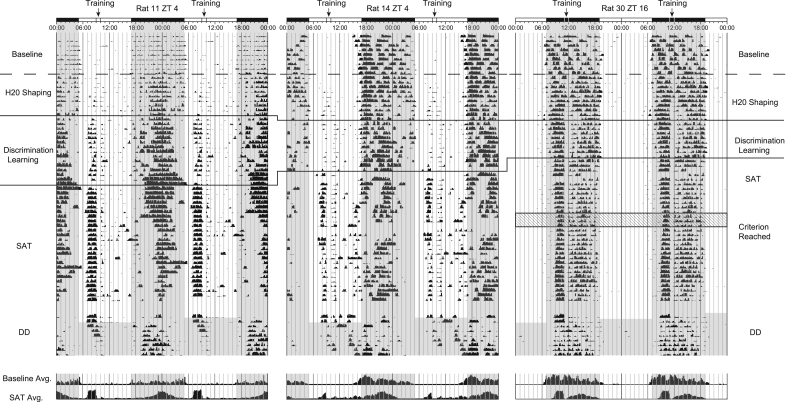
Figure 4.
Representative double-plotted actograms for three animals training on the SAT. SAT training is relative to the topmost LD bar (where dark bar = lights-off), and the training marker represents the ∼40-min period in which animals are absent from their home cages during SAT training. Superimposed gray shading over the actogram marks periods where lights are off. Actograms are separated into two phases: The first phase represents a continuous 60 d, with the baseline period reflecting the first 10 plotted days. The dashed line denotes the onset of the water deprivation and a 3- or 4-d shaping phase (learning to press levers). The solid lines denote a variable training phase during which animals are introduced to discriminating between signal and nonsignal trials with the house-light off (discrimination learning). The following period represents training on the final version of the SAT and is characterized by a robust increase in anticipation for the daily training session and changes in nocturnal activity distribution. The hatched area represents the 3-d period in which this animal reaches criterion performance (see Results and Materials and Methods). The second phase of the actogram illustrates the final 2 d of SAT training and the first 7 d of activity under constant conditions after training had ceased (total darkness: DD). Note that activity continues at the time training would have normally occurred for several days after training had stopped under constant conditions. Time histograms at the bottom of each actogram represent averages of the daily bins of activity shown above from both baseline and SAT phases of training, with 48 h per line.

