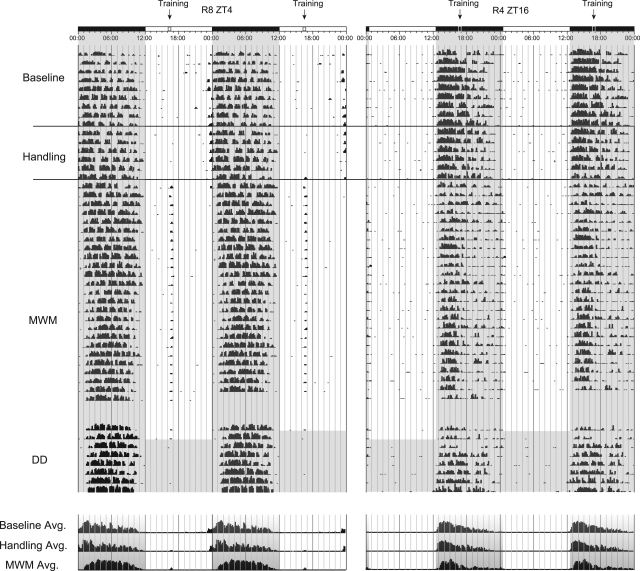
Figure 8.
Representative double-plotted actograms for animals training on the MWM. Training is relative to the topmost LD bar (where dark bar = lights-off) and the training marker represents the ∼20-min MWM training session in which animals are absent from their home cages (animals are moved to and from the testing area in groups of eight and tested one at a time). Superimposed gray shading over the actogram marks periods where lights are off. Actograms are separated into two phases: The first phase represents a continuous 40 d, with the baseline period reflecting the first 10 plotted days. The solid lines denote 1 wk of timed daily handling, with the remaining activity representing the first 24 d of the 28-d-long MWM training phase. The second phase of the actogram illustrates the final 2 d of MWM training and the first 7 d of activity under constant conditions after training had stopped (total darkness: DD). Time histograms at the bottom provide averages of the daily bins of activity shown above from both baseline and MWM training phases above.

