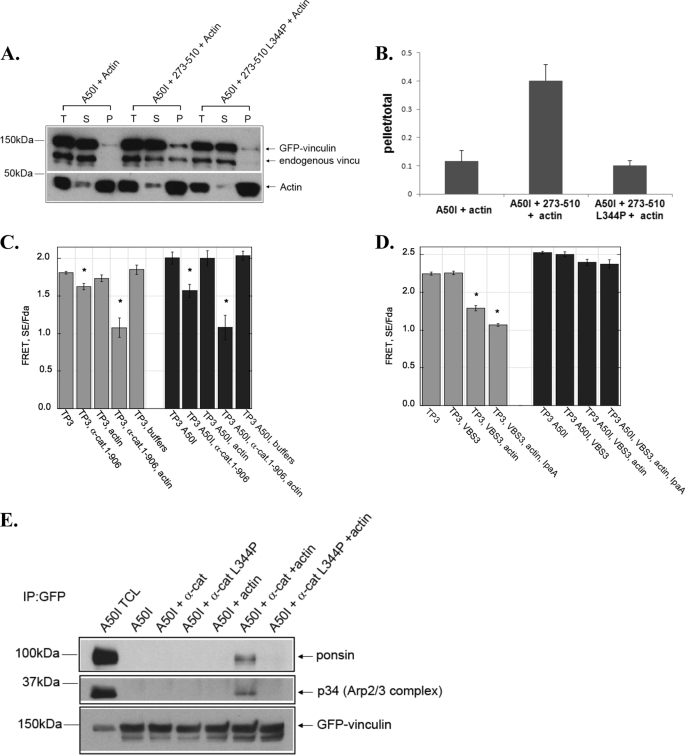
FIGURE 4.
α-catenin activates vinculin independently of the vinculin A50 residue. A and B, α-catenin triggers vinculin to co-sediment with actin filaments in the presence of an A50I substitution in vinculin. Lysates from cells expressing a GFP-tagged full-length vinculin harboring an A50I substitution prepared as described in the legend of Fig. 1A, and then incubated with 5 μm actin filaments (A50I +Actin), 10 μm His6-tagged α-catenin 273–510 and 5 μm actin filaments (A50I + 273–510 + Actin), or 10 μm His6-tagged α-catenin 273–510 L344P and 5 μm actin filaments (A50I+ 273–510 L344P + Actin). The mixtures were analyzed as described in the legend of Fig. 1A and the resulting immunoblot is shown in A. The immunoblot bands were quantified and expressed as described in Fig. 1. The graph in B represents the mean ± S.E. from three independent experiments. C, full-length α-catenin induces activating conformation changes in WT vinculin and vinculin A50I. Cell lysates from HEK 293 cells transfected with vinculin probe TP3 (gray bars) or TP3 A50I (black bars) were treated with indicated proteins. The concentration for full-length α-catenin is 8 μm, and actin is 5 μm. The FRET SE/Fda was obtained as described in Ref. 20 and “Experimental Procedures.” Plots are an average of n = 3 ± S.E. D, VBS3 and IpaA do not induce activating conformational changes in Vinculin A50I. Cell lysates were treated with VBS3(4 μm) or IpaA (4 μm) and actin (5 μm). Plots are the mean of n = 3 ± S.E. E, α-catenin induces vinculin A50I to bind to conformation specific ligands. The co-immunoprecipitation of vinculin A50I with ponsin or the Arp2/3 complex was assessed as described in Fig. 1F. TCL denotes a sample of total cell lysates.

