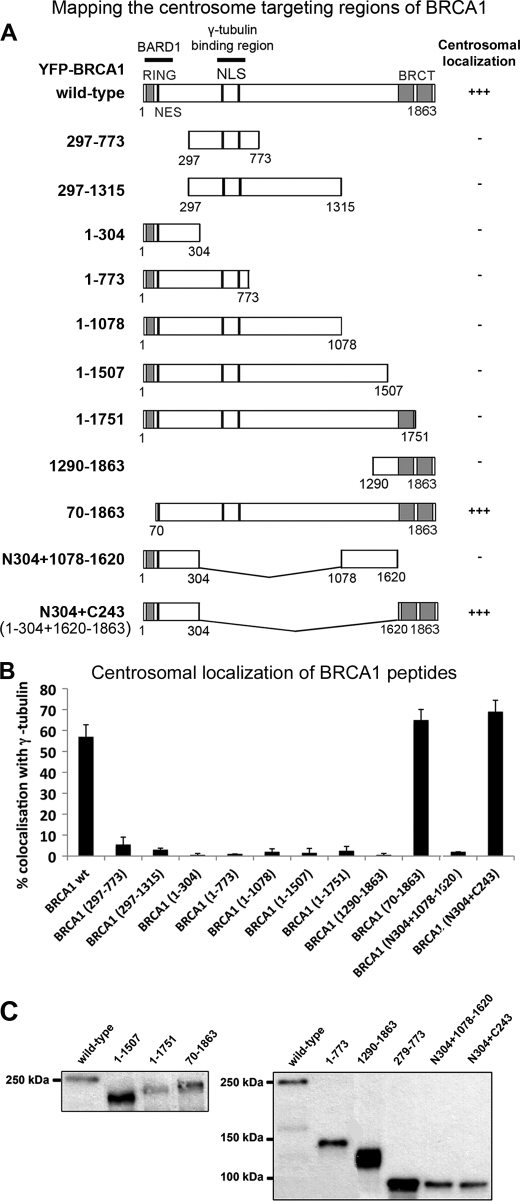
FIGURE 2.
Mapping of BRCA1 centrosome targeting domains. A, diagram showing the position of BRCA1 protein domains: the RING and BRCT domains, NLS, NES, and the binding regions for BARD1 and γ-tubulin. A range of YFP-tagged BRCA1 deletions and fusions were transiently expressed in MCF-7 cells and then fixed with acetone/methanol and analyzed for co-localization of BRCA1 with γ-tubulin by immunofluorescence microscopy (as detailed in the legend to Fig. 1). The relative degree of centrosome-positive BRCA1 staining is indicated in the right-hand panel. B, pYFP-BRCA1-transfected cells were scored for centrosomal localization of ectopic BRCA1 sequences by fluorescence microscopy, and the data were graphed as shown. Scoring data are from three independent experiments, scoring at least 100 cells/experiment (mean ± S.D. (error bars)). C, BRCA1 plasmids not already characterized previously (see “Experimental Procedures”) were confirmed for correct size of the YFP-fusion by Western blot, analyzing total lysates from transfected cells. Note that despite variations in band intensity from total extracts, only cells with similar levels of moderate YFP-BRCA1 expression were analyzed in single cell microscopy assays.

