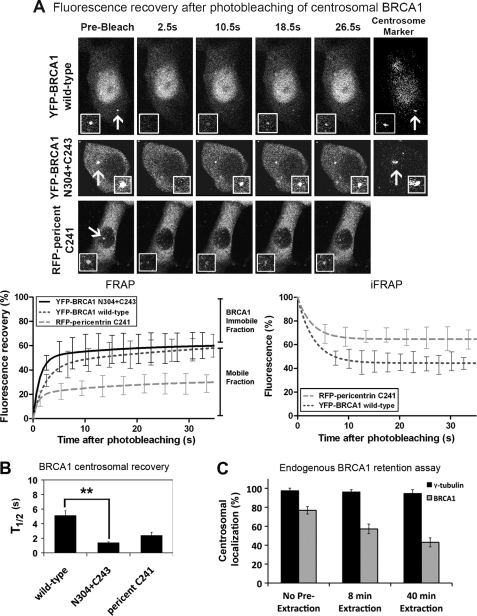
FIGURE 4.
Defining the dynamics of YFP-BRCA1 turnover and retention at the centrosome in live cells. A, FRAP analysis was performed on MCF-7 cells transfected with plasmids encoding RFP-pericentrin C241 and YFP-BRCA1 (wild type or N304+C243 mutant). Centrosomes were targeted for laser photobleaching followed by fluorescence time lapse microscopy. Representative prebleach, first image postbleach, and images for 10.5, 18.5, and 26.5 s after bleach are shown for each construct as well as the marker for the centrosome, RFP-pericentrin C241. The insets show higher magnification views of the centrosome. Corresponding FRAP recovery curves are shown for each protein in comparison with RFP-pericentrin C241 (recently described in Ref. 37), indicating the immobile and mobile fractions (left). YFP-BRCA1 (wild type) and RFP-pericentrin were also analyzed by an inverse FRAP (iFRAP) assay, bleaching cellular fluorescence, and then quantifying the rate of loss from the centrosome (right). B, the t½ (half-time ± S.E. (error bars)) and immobile fraction (percentage ± S.E.) are shown for each protein with an average of 10–15 cells over at least two experiments analyzed for each. Student's t test was used to show a significant difference in t½ between wild-type and N304+C243 peptides. **, p < 0.01. C, in an in vitro assay to measure BRCA1 centrosomal retention, cells were treated with CSK detergent buffer for 0, 8, or 40 min prior to fixation with acetone/methanol to remove soluble protein. Cells were then immunostained with BRCA1 antibody, co-stained for γ-tubulin, and scored by microscopy for the percentage of cells still displaying endogenous BRCA1 at the centrosome.

