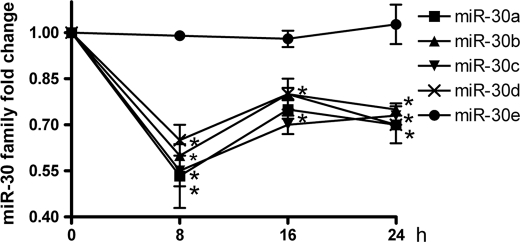
FIGURE 1.
Dynamic changes of miR-30 family members during BMP-2-induced preosteoblast differentiation. Shown are relative expression levels of miR-30 family members. MC3T3-E1 cells were treated with BMP-2 for 0, 8, 16, and 24 h, and the relative levels of miR-30 family members to sno202 RNA were determined by TaqMan MicroRNA expression assay. Data are expressed as mean ± S.D. of each group of cells at each time point from three separate experiments. The control at the 0 h time point was designated as 1. *, p < 0.05.

