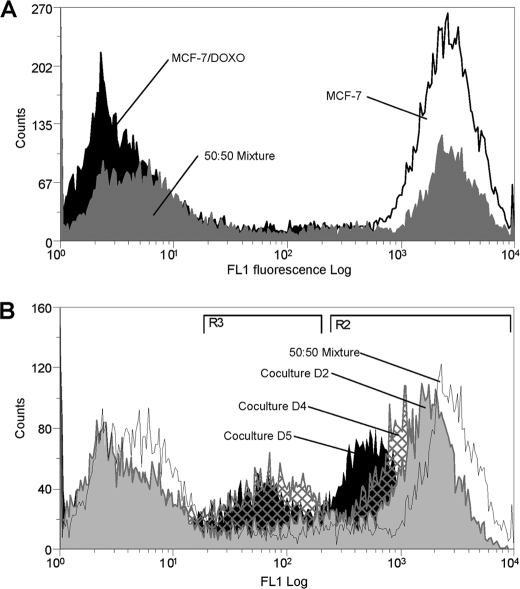
FIGURE 3.
Analysis by flow cytometry of P-gp activity transfers in co-cultures. P-gp activity was measured as the ability to efflux the fluorescent P-gp substrate calceinAM. Intracellular fluorescence accumulation was quantified by flow cytometry in the FL1 channel. A, P-gp activity was measured in parental MCF-7 cells (open black histogram), in resistant MCF-7/Doxo cells (solid black histogram), or in an extemporaneous mixture of 50:50 MCF-7:MCF-7/Doxo (solid gray histogram). B, P-gp activity was measured in co-cultures. A 50:50 MCF-7:MCF-7/Doxo cell mixture was seeded on culture dishes at day 0 and trypsinized after increasing co-culture durations. P-gp activity distribution in an extemporaneous mixture of 50:50 MCF-7:MCF-7/Doxo was superimposed for comparison (open black histogram). Results obtained at days 2 (solid gray histogram), 4 (hatched histogram), and 5 (solid black histogram) show a gradual shift to the left of the peak initially corresponding to sensitive MCF-7 low activity. In addition, a third population exhibiting a middle range P-gp activity progressively appears with time.

