FIGURE 3.
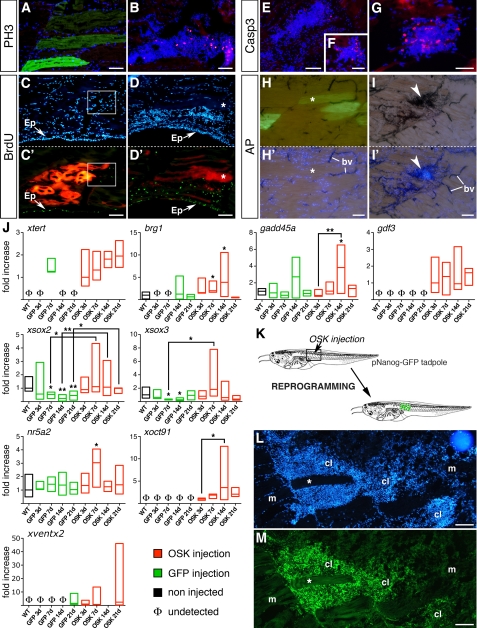
Cell clusters are proliferative and express endogenous pluripotency markers. Using PH3-antibody (A and B) and BrdU labeling (C′ and D′), cell proliferation was compared at 14 dpi between GFP (A) or RFP (C and C′) controls and OSK-injected muscles (B, D, and D′). PH3-positive cells (B) and strong BrdU labeling (D′) occurred in OSK clusters, but not in controls (A and C′). Note that BrdU labeling shows similar proliferative status of epidermis (Ep) in both conditions. Apoptosis was followed using active caspase 3 antibody in OSK-transfected muscles at 14 dpi (E and F) and 21 dpi (G), showing an increase of apoptotic cells in clusters. AP activity was strong in OSK-injected muscles at 14 dpi and co-localized with DAPI-positive clusters (I and I′, arrows), whereas GFP-controls (G and G′) showed no AP labeling except in blood vessels (bv). Each labeling was performed ≥3 times. Scale bars, 100 μm (A–E and H–I′); 50 μm (F and G). J, expression of xtert, brg1, and gadd45a (epigenetic and chromatin-remodeling markers) and nr5a2, xoct91, gdf3, xsox3, xsox2, and xventx2 (pluripotency factors) at 3, 7, 14, and 21 dpi in GFP-controls (green boxes) and OSK-transfected muscles (red boxes), using real-time quantitative PCR. For each gene, basal levels in non-injected muscles are indicated (WT, black boxes) and absence of transcript noted as Φ. Samples were from independent experiments, with three muscles pooled per sample (4 ≤ n ≤ 8 samples per group). mRNA levels were expressed as relative to WT except when expression was not detected, then mRNA levels were expressed as relative to the first value observed for OSK. Boxes represent minimum and maximum values around the median. Non-parametric Mann-Whitney U test was used to assess statistical differences versus WT, except when indicated by black bars: **, p < 0.01; *, p < 0.05. K, schematic representation of the protocol used in reprogramming experiment performed with the pNanog-GFP transgenic tadpoles. L and M, GFP immunolabeling of a pNanog-GFP transgenic Xenopus tadpole injected with OSK shows a strong and specific GFP expression in clusters (cl) at 7 dpi, whereas muscle fibers (m and *) are GFP-negative. Scale bars, 100 μm (K–L).

