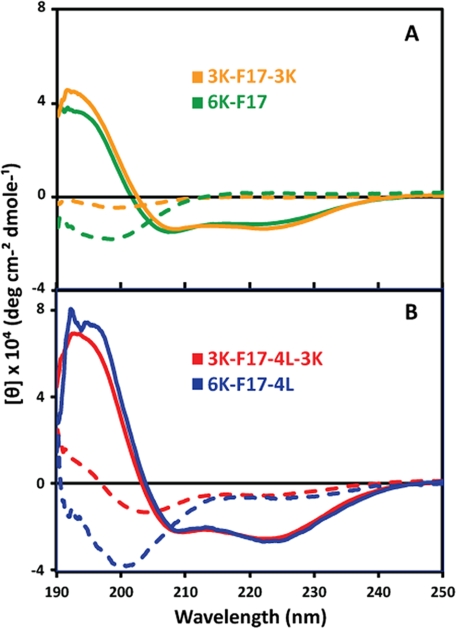
FIGURE 1.
CD spectra of CAPs in aqueous solution and SDS micelles. The spectra were measured at 20 μm each CAP in 10 mm Tris-HCl and 10 mm NaCl (pH 7.0) in the presence (solid lines) and absence (dashed lines) of 10 mm SDS. The peptide sequences are given in Table 1. The curves are based on triplicate measurements with the buffer background subtracted. deg, degrees.

