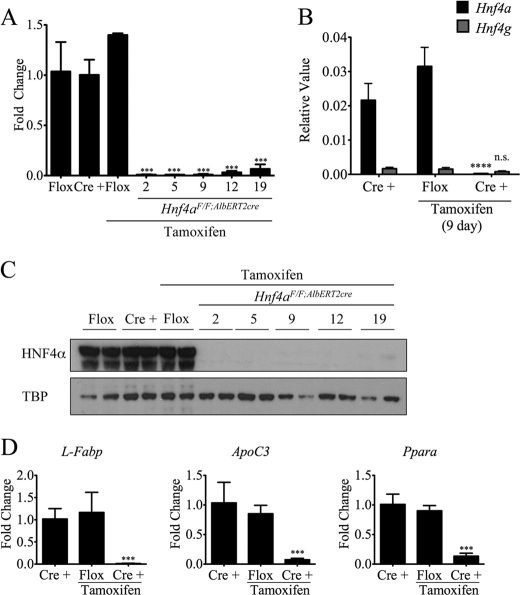
FIGURE 1.
Characterization of the temporal and tissue-specific Hnf4aF/F;AlbERT2cre knock-out mouse. A, Hnf4a mRNA expression as determined by qRT-PCR. Livers (n = 3) from Hnf4aF/F;AlbERT2cre mice (Cre +) were collected at the indicated times after tamoxifen treatment. Nineteen-day Hnf4aF/F mice (Flox) were used as a control for tamoxifen exposure. Values were normalized to actin and represented as -fold change over expression in control Hnf4aF/F mice. Statistically significant changes from Hnf4aF/F control mice as determined by one-way ANOVA are indicated (***, p < 0.0005). B, qRT-PCR expression analysis for Hnf4a and Hnf4g was performed on RNA from 9-day tamoxifen-treated Hnf4aF/F;AlbERT2cre mice. Values shown are relative expression levels. Statistically significant changes from Hnf4aF/F;AlbERT2cre control mice as determined by one-way ANOVA are indicated (****, p < 0.00005). C, Western blot analysis of nuclear protein extracts from two mice per group. Blots were probed with anti-HNF4α antibody or the nuclear loading control TATA-binding protein (TBP). Nineteen-day tamoxifen-treated Hnf4aF/F mice were used as a control for tamoxifen exposure. D, qRT-PCR analysis of known HNF4α target genes in 19-day tamoxifen-treated livers (n = 3). Values were normalized to actin expression and represented as -fold change over control Hnf4aF/F;AlbERT2cre. Statistically significant changes from Hnf4aF/F;AlbERT2cre control mice as determined by one-way ANOVA are indicated (***, p < 0.0005). Error bars, S.D.

