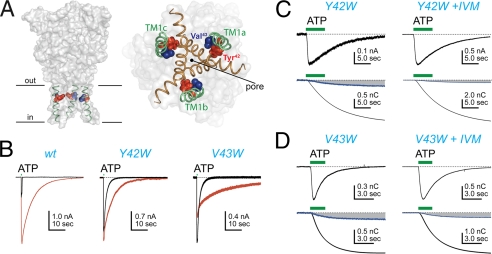
FIGURE 3.
Site-directed mutagenesis of TM1. Panel A shows the location of Tyr42 (red spheres) and Val43 (blue spheres) along TM1 (green) in a homology model of the hP2X4R. The left schematic shows the channel viewed parallel to the membrane. The inner and outer limits of the membrane are marked with lines. The right schematic shows the protein viewed parallel to the 3-fold axis of symmetry from the intracellular side of the membrane. TM1 (green) lies lateral to TM2 (brown) and the pore. Panel B shows the effect of IVM (3 μm) on the ATP-gated (3 μm) currents of the wt and mutant receptors. Panels C and D show ATP-gated (30 μm) current and fluorescence traces recorded in the presence and absence of 10 μm IVM. These mutations had no significant effect on Pf% by comparison to the wt hP2X4R and no significant effect on the ability of IVM to reduce the Pf% (see Table 1).

