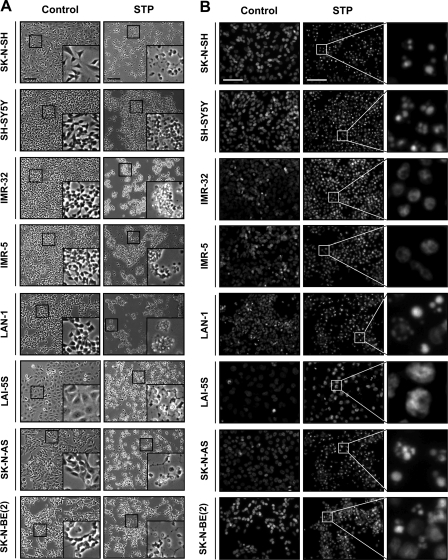
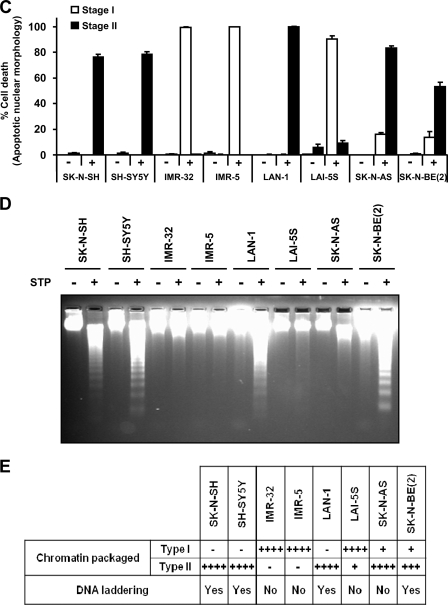
FIGURE 1.
Analysis of apoptotic hallmarks in different human neuroblastoma-derived cell lines upon STP treatment. Eight different neuroblastoma cell lines (SK-N-SH, SH-SY5Y, IMR-32, IMR-5, LAN-1, LAI-5S, SK-N-AS, and SK-N-BE(2)) were left untreated (Control) or treated with 1 μm STP for 24 h. A, microphotographs using a phase contrast microscopy show the morphological appearance of the different cell lines after the indicated treatment. The insets are higher magnifications of the cells framed in the images. The bars indicate 40 μm. B, shown is the morphological appearance of the nuclei stained with Hoechst 33258. The right panels are higher magnifications of the cells framed in the middle panels. The bars indicate 40 μm. C, shown is quantification of cell death by counting stage I or stage II nuclear morphology according to “Experimental Procedures.” Values are expressed as the means ± S.E. D, genomic DNA analysis of the different cell lines by conventional agarose gel electrophoresis and the subsequent ethidium bromide staining is shown. E, shown is a table summarizing the percentage of chromatin-packaged stage observed in the different cell lines and its correlation with their ability to degrade their DNA into LMW size fragments. Note that SK-N-AS cells show stage II nuclear morphology in the absence of a DNA laddering pattern. + means <25%; ++ means 26–50%; +++ means 51–75%, ++++ means >76% of nuclei in stage I and/or stage II apoptotic nuclear morphology.


