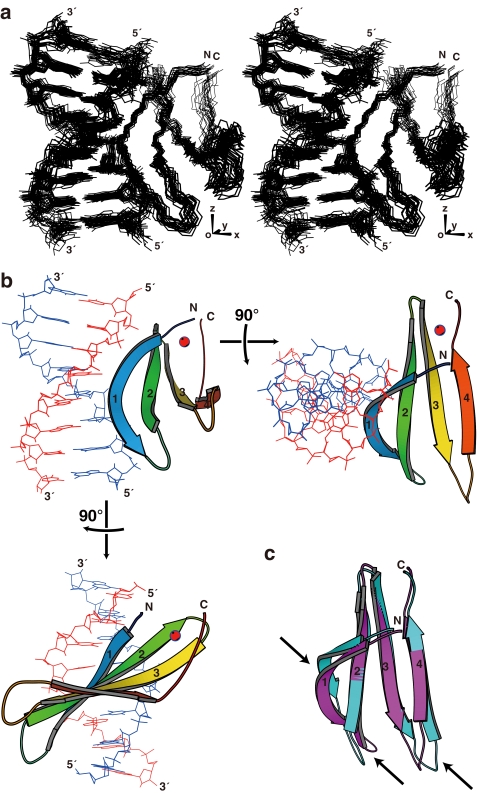
FIGURE 2.
Structure of the complex of AtWRKY4-C and the W-box DNA. a, ensemble of the 20 selected structures in stereo view, which were fitted using the atoms shown, i.e. backbone non-hydrogen atoms in the protein and all non-hydrogen atoms in DNA. b, ribbon diagram of the representative structure with the lowest energy. c, comparison of the AtWRKY4-C structures in the complex with DNA (magenta) and the free protein (cyan; Protein Data Bank code 1WJ2). In a, the axes regarding the alignment tensor are indicated. In b, the four β-strands are numbered from the N terminus, and the zinc ion is shown as a red sphere. In c, the arrows indicate regions with a relatively large structure perturbation caused by DNA binding. The region of the protein presented is Tyr-412–His-465, and that of the DNA presented is C4–C11/G4′–G11′. The figures were produced by MolScript (40).

