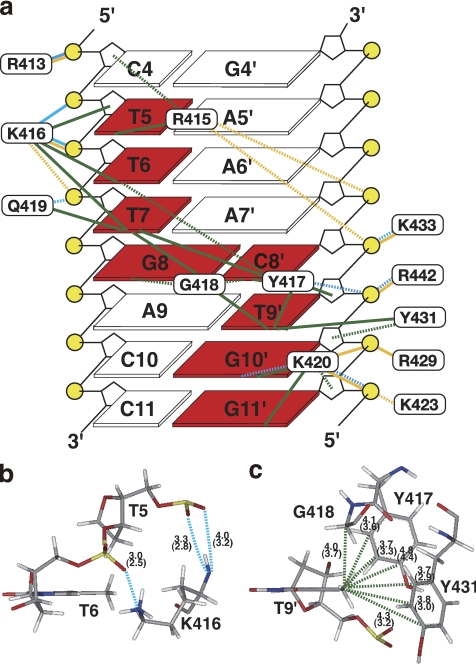
FIGURE 3.
Intermolecular contacts. a, summary of microscopic forces identified in the interface between AtWRKY4-C and the W-box DNA (bases in squares are numbered as in Fig. 1a), which were drawn looking from the major groove side of DNA. DNA bases, the sugar backbone, and phosphates are shown by squares, black lines, and yellow circles, respectively. Bases contacted by the protein are highlighted in red. Cyan, yellow, and green lines represent hydrogen bonds, contacts by electrostatic attraction, and apolar contacts, respectively, as defined under “Experimental Procedures.” Solid and dashed lines indicate that these contacts were identified in ≥75% and ≥40% of the structures, respectively. b, hydrogen bonds formed by backbone and side chain nitrogen atoms of Lys-416 are indicated by dashed cyan lines. The average and minimal (in parentheses) distances between donor nitrogen and acceptor oxygen atoms in the selected structures are shown. c, apolar contacts with the methyl group of T9′ (dashed green lines), with the average and minimal (in parentheses) C-C distances indicated. The figures in b and c were produced using the Insight II molecular display program.

