Figure 4.
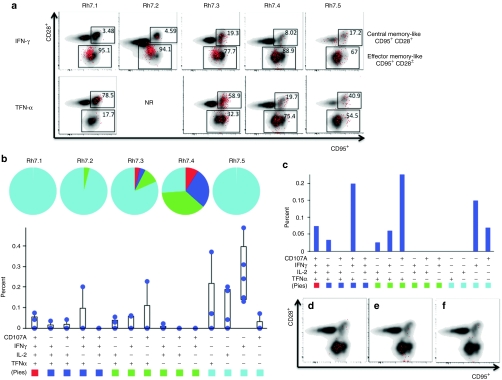
Analysis of CD8+ NS3-specific T cell responses. PBMCs were stimulated with HCV NS3 peptides, overlapping by eight amino acids and spanning the entire length of the NS3 protein. (a) Analysis of CD8+ IFN-γ+ and CD8+ TNF-α+ T cell responses (red) based on CD28 and CD95 staining. (b) PBMCs were stained intracellularly for IFN-γ, TNF-α, IL-2, and CD107A and were analyzed for polyfunctionality. Pie charts represent the proportion of NS3-specific CD8+ T cells for each animal that have one function (light blue), two functions (green), three functions (dark blue), and four functions (red). The graph is the average polyfunctional NS3-specific CD8+ T cell response among all five animals. Values are represented as mean + SEM, n = 5 per group. (c) Graph of the polyfunctional NS3-specific CD8+ T cell response of Rh7.4. (d–f) The three largest NS3-specific polyfunctional CD8+ T cell responses (red) of Rh7.4 were plotted based on CD28 and CD95 expression. (d) TNF-α+ CD107A+, (e) TNF-α+ CD107A+ IFN-γ+, (f) TNF-α+ CD107A+ IL-2+ IFN-γ+. HCV, hepatitis C virus; NR, no response; PBMC, peripheral blood mononuclear cell.

