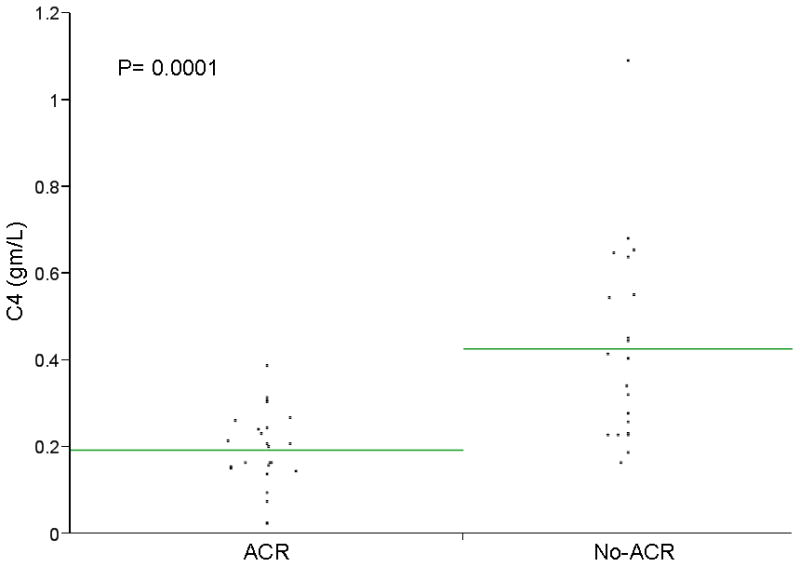
Figure 1. C4 serum level in Acute Cellular Rejection and Non-rejection groups.

A scatter plot of individual values for C4 and C1q are shown. Mean C4 levels were significantly lower among patients with ACR (p=0.0001). Using a cut off value for C4 of ≤0.31gm/L, C4 had a sensitivity of 97%, a specificity of 62%, a positive predictive value of 74% and a negative predictive value of 94% in identifying patients with ACR. Mean C1q was also significantly lower among patients with ACR (p=0.0183).
