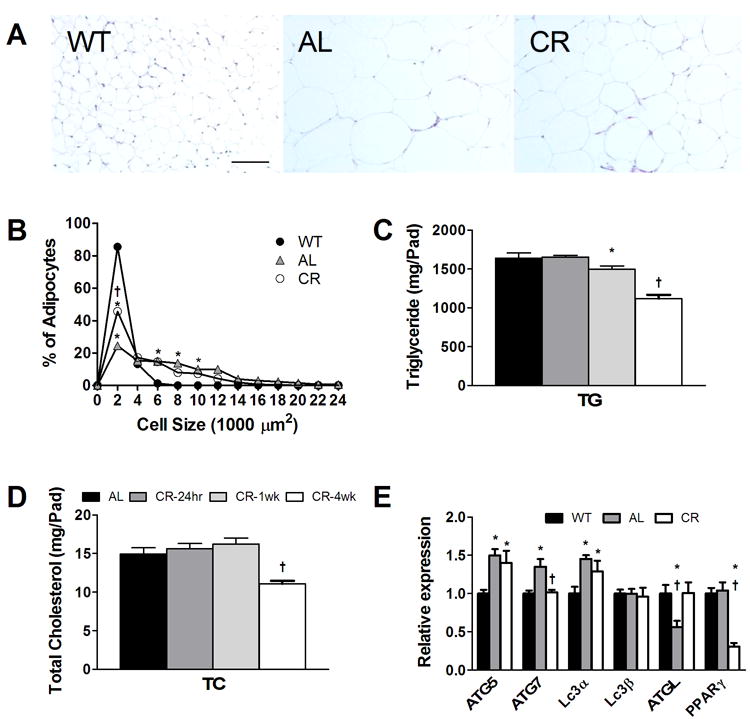
Fig. 2.

Characterization of abdominal adipose tissue from lean and obese mice. (A) Hematoxylin-eosin stained adipose tissue showing differences in adipocyte sizes among the groups (20X magnification, bar = 100 μm). (B) Graphs of relative distribution of abdominal adipose tissue adipocyte areas for the three groups at 12 weeks of age. Error bars are imbedded within symbols. *p<0.05 between WT and db/db groups; †p<0.05 between AL and CR mice, n=3-4. (C,D) Adipose tissue (D) total triglyceride and (E) total cholesterol mass per total fat pad taken from AL mice at 8 wks (dark bar) and following CR for 24 hours (dark gray bar), 1 week (gray bar) and 4 weeks (white bar). (E) mRNA levels of autophagy and metabolism genes quantified by RT-PCR from abdominal adipose tissue taken at 12 weeks of age from the three mouse groups. *p<0.05 between WT and db/db groups; †p<0.05 between AL and CR mice, n=8. *p<0.05 between CR at 24 hours and 1 week; †p<0.05 between mice CR for 4 wks and all other groups; n=4.
