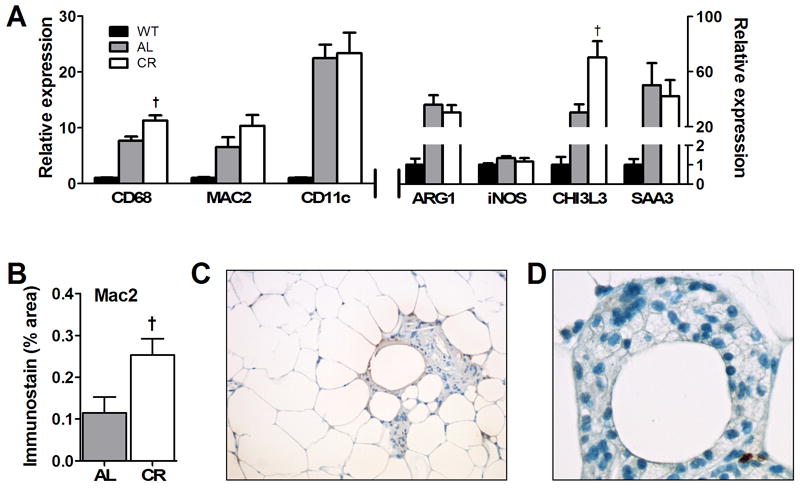
Fig. 3.

Inflammatory gene and protein expression and morphometry of abdominal adipose tissue from WT and db/db mice. (A) mRNA levels for multiple inflammatory and macrophage genes quantified from abdominal adipose tissue taken at 12 weeks of age using RT-PCR as described in the text. Significant differences between WT and db/db groups were seen for all markers (p<0.05, n=8); †p<0.05 between db/db diet groups. (B) Quantification of immunostaining for Mac-2 in sections of adipose tissue taken from AL and CR mice and processed as described in the text. †p<0.05 between db/db diet groups; n=3-4. (C) Example abdominal adipose tissue section taken from db/db AL mouse and stained with hematoxylin-eosin to show accumulation of ATMs that are in this case, focused around adipocytes appearing to undergo cell death. (D) Example of a crown-like structure (CLS) of leukocytes surrounding what appears to be a dead adipocyte taken from CR adipose tissue to illustrate the common lipid-laden appearance of these cells (originally X40 magnification)
