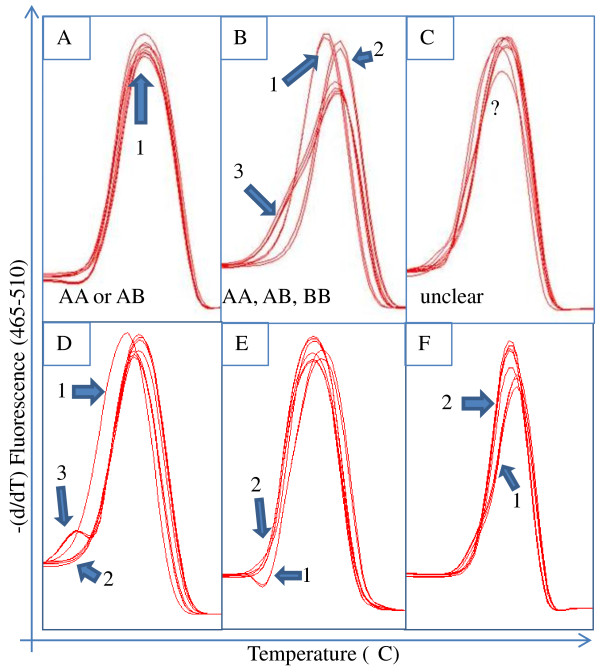
Figure 2.
Analysis of variation of identified SNPs via high resolution melting (HRM) curves generated on 8 cultivars used in this study. HRM derivative plots, -(d/dT) fluorescence as a function of temperature, of several primer sets when analyzing 8 sweet cherry cultivars representing the common patterns observed during analysis. Comparisons outside one frame are not meaningful and the frames are not to scale with each other as the curve shape is the focus. A-C are from primers amplifying a region expected to contain 1 putative SNP while D contains 2, E has 3, and F contains 5. A. Primer set 121 produces a single curve pattern denoted by an arrow representing either a homozygous locus across all 8 cultivars tested or a heterozygous locus shared by all 8 tested cultivars. B. Primer set 100 has three distinct curve patterns highlighted as 1, 2 and 3 representing three allelic forms at the sampled locus. C. Primer set 115 has an indiscernible pattern. D-F. Each demonstrates variation in the population; however, the more SNPs present in the amplified region the smaller the differences among the melt curves.

