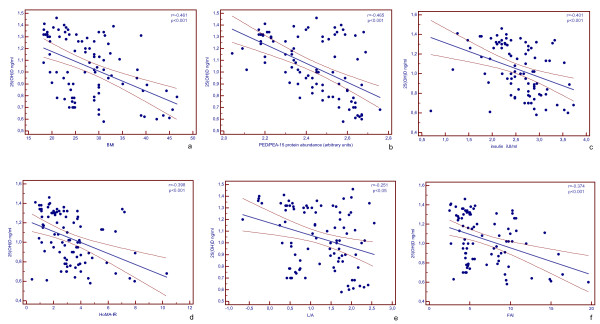
Figure 1.
Correlations between variables in the study population. 25(OH)D, 25(OH) Vitamin D; BMI, body mass index; HoMA-IR, homeostasis model assessment of insulin resistance; FAI, free androgen index; L/A, leptin-to-adiponectin ratio. Fasting 25(OH)D, insulin, PED/PEA-15 protein abundance, leptin, and adiponectin values were not normally distributed and have been logarithmically transformed. PED/PEA-15 protein bands were quantified by laser densitometry and expressed as arbitrary units [13]. Bivariate correlations between variables were examined using Pearson's correlation coefficient and their values are singularly evidenced.

