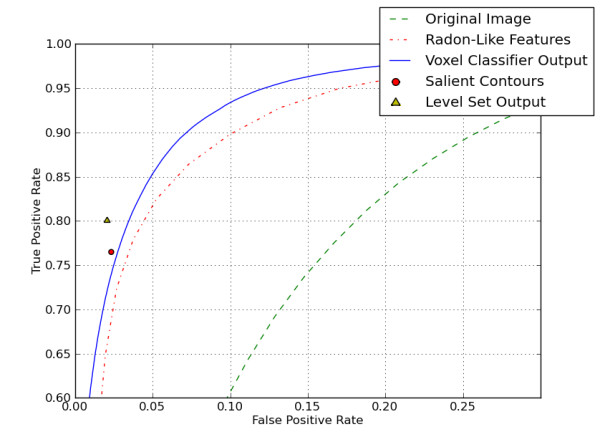
Figure 3.

ROC results for each step of the automatic segmentation process. ROC results for Test 1. The dotted ROC curve is for a simple threshold of the raw data. The solid ROC curve is for the random forest based patch classifier. The dot-dash ROC curve is for the Radon-Like Features output. The circle marker shows the false positive rate and true positive rate when the pixels inside of automatically detected salient contours are marked as mitochondria (classification was performed on contour pairs). The triangle marker shows the false positive rate and true positive rate when inner points of salient contours are used to initialize a level set operation.
