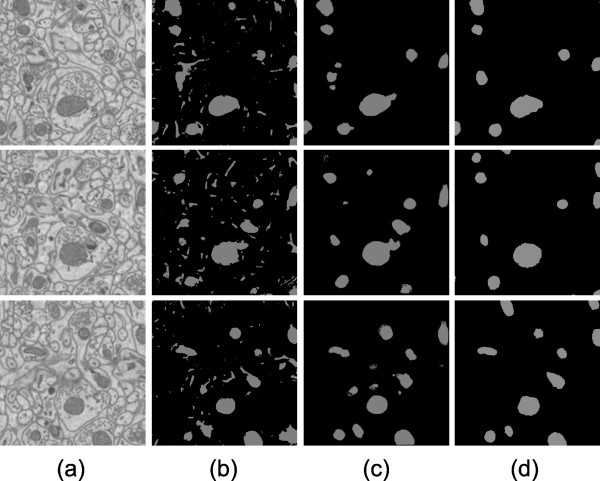
Figure 5.
Automatic results versus manually generated results for Test 1. Test 1 was performed on cerebellum tissue if a mouse. The XY slices shown here are 3.1 μm × 3.1 μm. Out of the 15 XY slices processed, slice numbers 1, 7, and 13 are shown (from top to bottom). Column (a) shows raw images. Column (b) shows final results of automatic segmentation using Radon-Like Features. Column (c) shows final results of automatic mitochondria segmentation using the CP method presented in this paper. Column (d) shows manually generated mitochondria segmentation. Differences between the automatic (b) and manual (d) images shown here represent error for the process presented in this paper. Differences between the automatic (c) and manual (d) images shown here represent error for the Radon-Like Features method.

