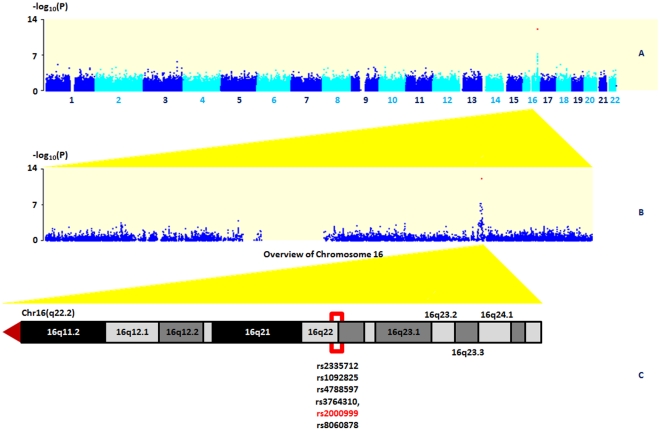
Figure 1. Manhattan plot of the GWAS of the discovery cohort comprising 631 children.
A, A Manhattan plot showing the −log10(P values) of SNPs from the association analysis of the 631 SFS children from stage 1. B, An overview of the −log10(P values) of Chromosome 16. C, The genomic region of the 618 LD block displayed in UCSC Genome Browser.

