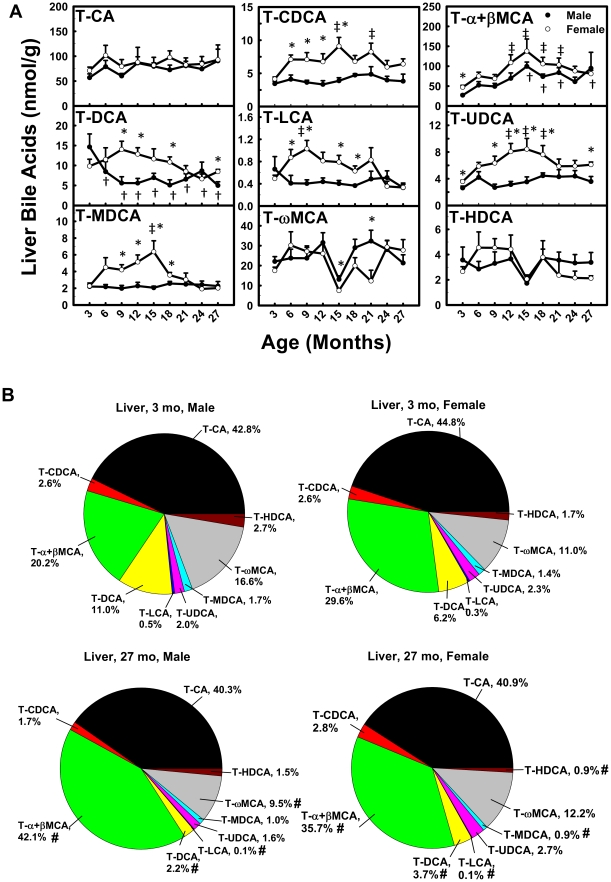
Figure 6. Concentrations of conjugated BAs in liver during aging of male and female mice.
(A) Concentrations of individual conjugated BAs in liver during aging and (B) proportions of them in all conjugated BAs in liver at 3 and 27 months of age in male and female mice. Data are presented as means ± SEM of 5–7 mice. Daggers (†) represent statistically significant difference from the value at 3 months of age during aging of male mice. Double daggers (‡) represent significant difference from the value at 3 months of age during aging of female mice. Age-dependent differences were considered at p<0.05 by one-way ANOVA, followed by Duncan's post-hoc test. Asterisks (*) represent statistically significant difference between male and female mice at respective ages during aging (p<0.05), by student t-test. In panel B, pound signs (#) represent differences of BA proportions between 3 and 27 months.

