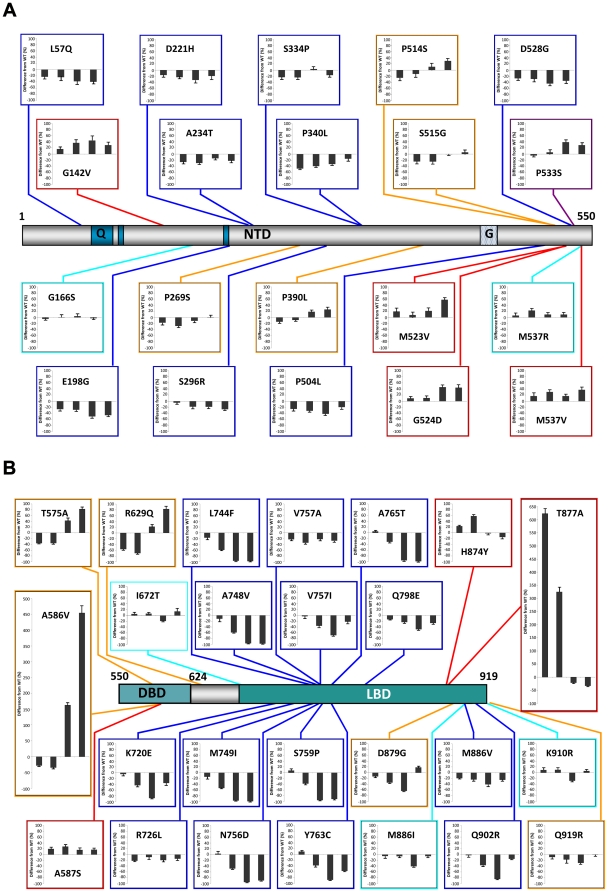
Figure 3. Stimulatory capacity of hAR mutations present in prostate cancer.
COS-7 cells were cotransfected with GRE2-TATA-Luc reporter plasmid and pSVARo encoding the indicated AR mutation. After treatment with DHT, the luciferase activity was determined. The ability of each AR mutation to upregulate GRE2-TATA-Luc was calculated as the fold stimulation at each concentration of DHT compared to untreated cells expressing WT AR. The results are presented as the percentage difference between the mutant and WT AR at each concentration of DHT. Therefore, values below and above zero represent loss and gain of function compared to WT AR respectively. The concentrations of DHT used were: 0; 0.1; 1.0 and 10 nM with the corresponding values displayed from left to right in all charts Values are means of between three and five independent experiments performed in quadruplicate ± SEM. The positions of the mutations are indicated with reference to a schematic representation of the hAR drawn to scale. Q, polyglutamine region; G, polyglycine region. The different classes of mutation are denoted by colour: turquoise, no significant difference from WT; blue, loss of function; plum, gain of function upon binding of DHT; orange, loss of function changing to WT values or gain of function upon binding of DHT; red, constitutive gain of function.

