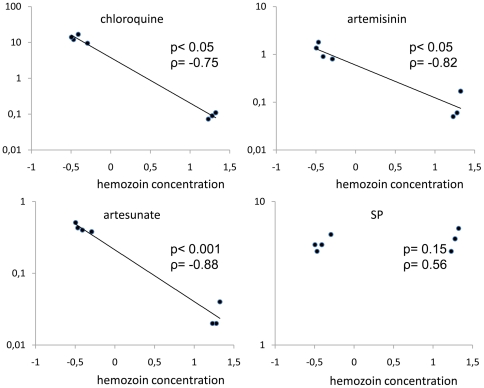
Figure 5. Correlation between IC50 values for CQ, ART, artesunate and SP in selected and control lines.
The line for Y-ART2 was not included. IC50 values (mean of at least 3 independent experiments) are expressed in µM for CQ, ART, artesunate and as dilution (×106) of SP stock solution (200 mg sulfadoxine+10 mg pirymethamine/mL). The Hz content is expressed as the log of concentration (pmoles of FPPIX/1×106 trophozoites). A statistically significant negative correlation was found between the Hz content and the IC50 values for CQ (p = 0.03; ρ = −0.75) ART (p = 0.01; ρ = −0.82) and artesunate (p<0.001 ρ = −0.88) while there was no statistically significant correlation with the IC50 value for SP (p = 0.23, ρ = 0.7). *calculated by Spearman's rank-order correlation test.

