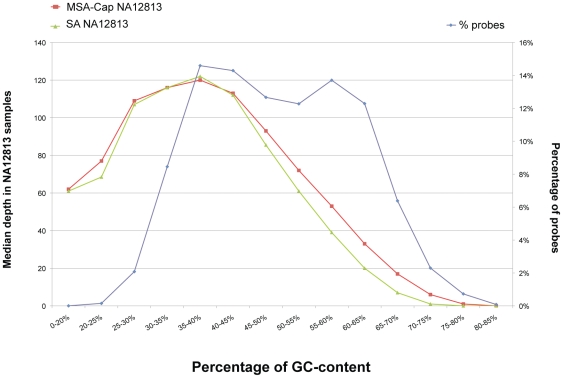
Figure 2. Capture efficiency of probes with different GC-content (percentage of GC bases from the total bases) for SA and MSA-Cap HapMap (NA12813) libraries.
The efficiency is shown as median depth of coverage of probe regions with different GC percentage. The GC percentage range of the probes is shown on the x axis. The median depth of coverage for the probes in the HapMap sample, either SA or MSA-Cap libraries, is represented on the left y axis. The percentage of probes in each GC content is shown on the right y axis.

