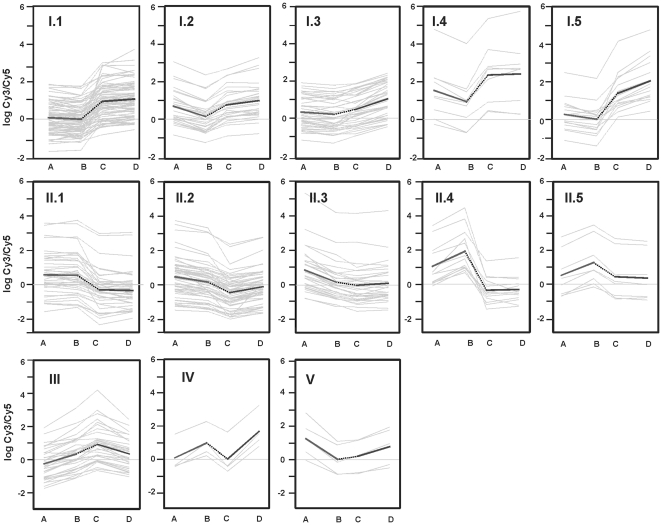
Figure 3. Transcription profiles.
Genes differentially expressed in MG cultures of S. coelicolor M145 (A); S. coelicolor M145 supplemented with arginine (B); S. coelicolor ΔargR (C) and S. coelicolor ΔargR supplemented with arginine (D). The genes have been grouped in types and subtypes according with their expression profile. Each grey line corresponds to the change in transcription of a given gene. The thicker line is the transcription mean profile for all the genes in the proposed group.

