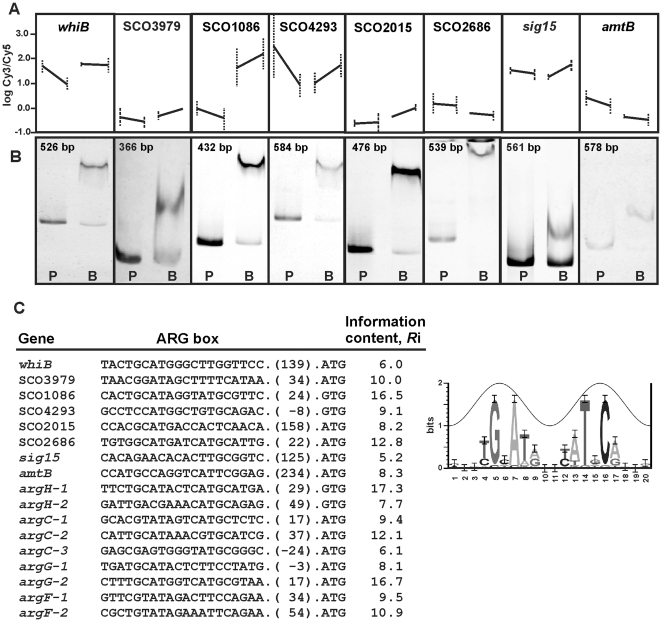
Figure 10. Functional analysis of ARG boxes by EMSA.
(A) Transcriptomic expression of the tested genes in the A, B, C and D conditions indicated in Fig. 3. (B) EMSA of PCR-amplified DNA fragments containing putative ARG boxes located upstream of the indicated genes. In all cases, P indicates the free probe and B binding reaction using ArgR (0.8 µM protein). The size of the probes is indicated in the panels. (C) Sequence of the putative ARG box present upstream of the indicated gene and Ri value determined using the ARG box model represented on the right. The numbers in parenthesis indicate the nucleotides to the translation start codon. The argH, argC, argG and arcB ARG boxes are included for comparison.

