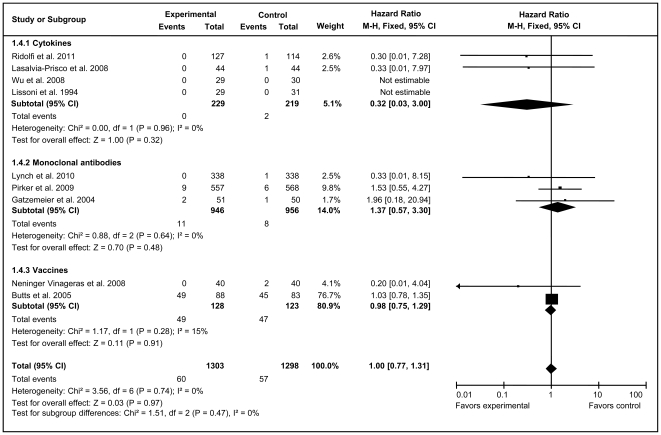
Figure 6. Forest plot of comparison of complete response of 9 included trials (Stage IIIA, IIIB, or IV NSCLC).
P values are from P-for-effect modification testing for heterogeneity within or across the groups of regimens. The sizes of data markers are proportional to the number of CR rate events in the trials. CI, confidence interval; HR, hazard ratio.

