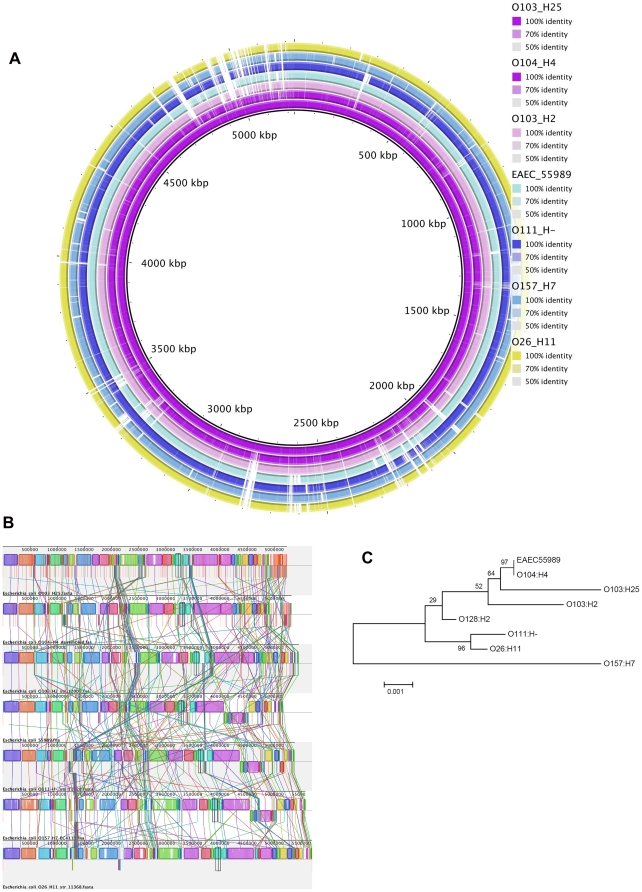
Figure 1. Genome comparisons of EHEC O103:H25 NOS and related E. coli strains.
A. BRIG blast atlas of EHEC O103:H25 NOS compared to EAEC O104:H4 GOS, EHEC O103:H2 str 12009, EAEC O104:H4 str 55989, EHEC O111:H- str 11128, EHEC O157:H7 EDL933 and EHEC O26:H11 str 11368. The white regions represent absent genetic regions. B. Whole genome alignment of EHEC O103:H25 NOS, EAEC O104:H4 GOS1, EHEC O103:H2 str 12009, EAEC O104:H4 str 55989, EHEC O111:H- str 11128, EHEC O157:H7 EDL933 and EHEC O26:H11 str 11368 (top to bottom) genomes using Mauve [15]. Each chromosome has been laid out horizontally and homologous blocks in each genome are shown as identically colored regions linked across genomes. C. Phylogenetic analysis of concatenated MLST gene alleles (adk, fumC, gyrB, icd, mdh, purA, recA) of EHEC O103:H25 NOS (ST2523), EAEC O104:H4 GOS (ST678), EAEC O104:H4 str 55989 (ST678), EHEC O103:H2 str 12009 (ST17), EHEC O26:H11 str 11368 (ST21), EHEC O111:H- str 11128 (ST16), EHEC O157:H7 EDL933 (ST11) and EHEC O128:H2 str 3171/00 (ST25) obtained from GenBank.

