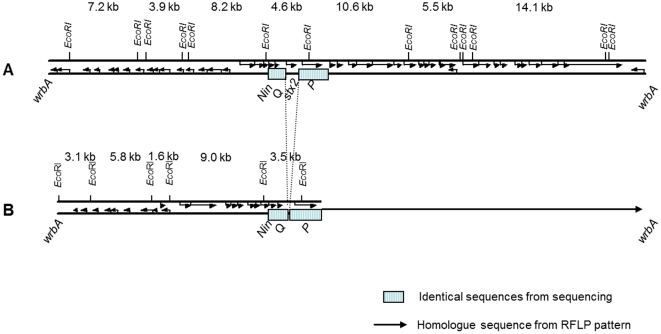
Figure 3. Comparison of Stx2 phage and stx-negative phage.
Comparison of Stx2 phage and stx-negative phage from EHEC O103:H25 NOS (A) and E. coli O103:H25 NVH-848 (B), respectively. The Stx2 phage is sequenced, while the illustration of the stx-negative phage is based on sequence (23 kb) and RFLP pattern (illustrated by arrow).

