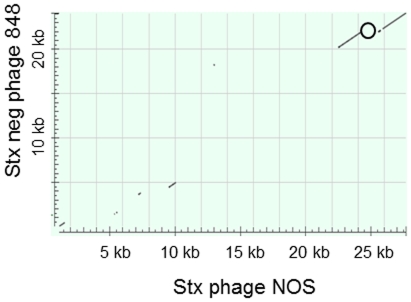
Figure 6. Early region of Stx2 phage compared to early region of stx-negative phage.
Dot matrix view of 24 kb early region of the Stx2 phage from EHEC O103:H25 NOS and the 23 kb early region of the stx-negative phage from E. coli O103:H25 isolate NVH-848. The position of the stx2 gene in EHEC O103:H25 NOS is marked (o). Regions of similarity are based upon the BLAST results. Alignments are shown in the plot as lines. Plus strand and protein matches are slanted from the bottom left to the upper right corner, minus strand matches are slanted from the upper left to the lower right. The number of lines shown in the plot is the same as the number of alignments found by BLAST.

