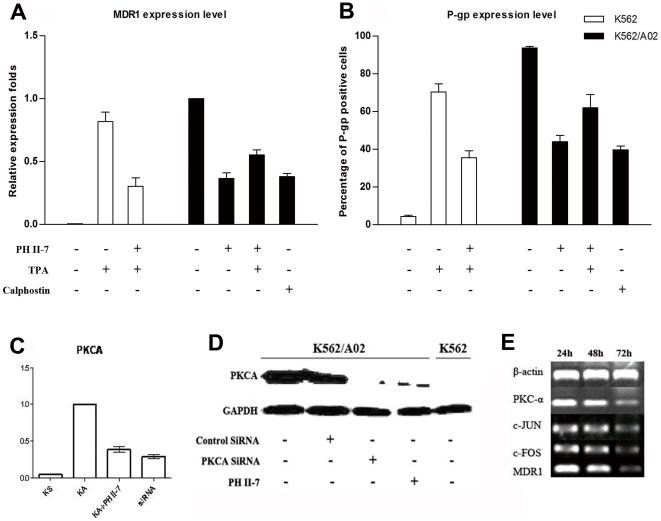
Figure 8. PH II-7 regulates MDR1/P-gp expression through a PKCA pathway.
(A) The expression of MDR1 in K562 and K562/A02 cells with or without the treatments of either PH II-7 (200 nM), TPA (100 nM), Calphostin (1 µM), or their different combinations, detected by RT-qPCR. Expression levels are normalized to that of untreated K562/A02 (as 1) (n = 4). (B) The surface expression of MDR1 in K562 and K562/A02 cells with or without treatments of either PH II-7, TPA, Calphostin, or their different combinations, detected by flow cytometry(n = 4). (C) mRNA expression of PKCA in K562, K562/A02, K562/A02 treated with PH II-7(200 nM), K562/A02 treated with siRNA targeting PKCA, detected by RT-qPCR (n = 4). (D) Western-blot, protein level of PKCA in K562/A02, K562/A02 treated with control siRNA(scramble), K562/A02 treated with siRNA targeting PKCA, K562/A02 treated with PH II-7(200 nM), K562. GAPDH was used as an internal control. (E) Transfection of K562/A02 cells with PKCA-targeted siRNA, resulted in mRNA expression knock down in PKCA, MDR1, and also two transcriptors downstream of PKCA, c-JUN, c-FOS.

