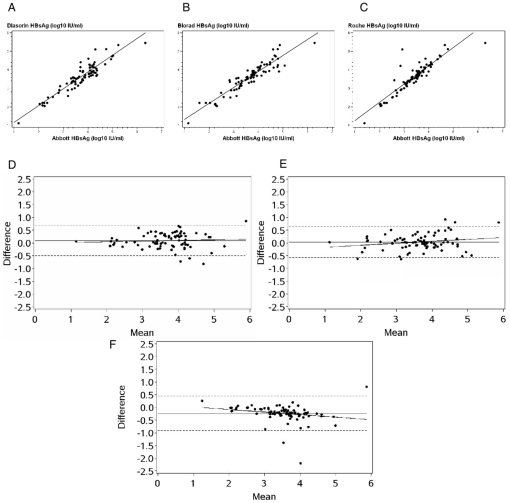
Figure 1. Comparison of the AgHBs concentrations between Abbott and Diasorin, Bio-Rad, Roche assays.
Linear regression analysis of HBsAg levels (expressed in log10 IU/ml) obtained by (A) Abbott vs. Diasorin, (B) Abbott vs. Bio-Rad, Abbott vs. Roche immunoassays, and Bland-Altman plot of HBsAg level differences between (D) Abbott and Diasorin, (E, F) Abbott and Bio-Rad, (G) Abbott and Roche immunoassays. The horizontal solid lines indicate the mean titer difference values, the dashed lines represent the ±1.96-SD limits from the means, and diagonal solid lines are the linear regression lines.

