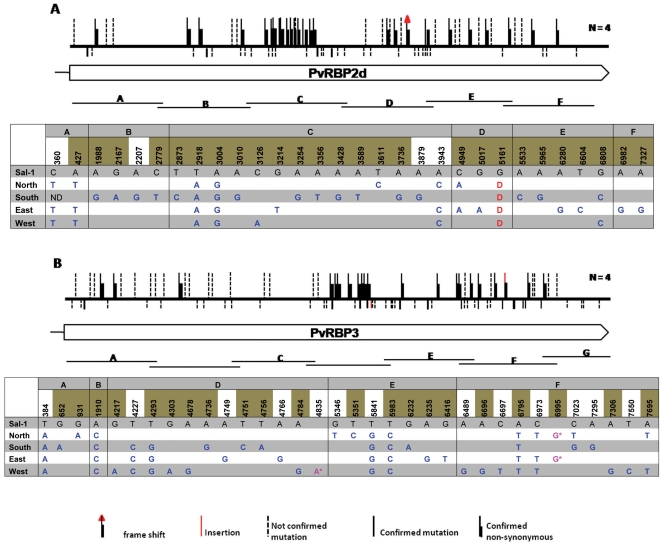
Figure 2. Schematic representation of the Pvrbp2d (A) and Pvrbp3 (B) genes.
In each panel, the location of the fragments cloned is indicated below the gene model. Above the gene model, synonymous mutations are indicated by vertical bars below the horizontal bar that represents the gene, whereas non-synonymous mutations are place above this horizontal bar. SNPs that have been confirmed from two independent PCR amplifications are shown as solid lines, whereas those observed only once are represented by dotted lines. The nature and location of the confirmed SNPs are also provided in the tables, with the non-synonymous mutations highlighted in olive green. As these two genes are pseudogenes, the consequence of the SNP, synonymous or non-synonymous, has been predicted assuming that a continuous reading frame.

