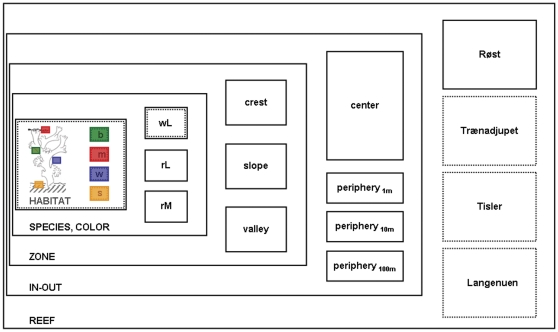
Figure 2. Multi-scale, hierarchical sampling design.
Nested frames indicate the different levels of observation, increasing in scale from inside (left) to outside (right). Boxes within frames symbolize each lower level as integral part of respective next higher level. At the main study site, Røst, sampling was implemented on all levels (continuous line); at all other sites, it was performed only on the lowest and highest level, respectively (dotted line). The following levels and scales of observation were considered: 1) HABITAT (µm–cm): coral branch surface (“b”), coral mucus (“m”), ambient seawater (“w”), proximal sediments (“s”); 2) SPECIES (cm–m) – white Lophelia pertusa (“wL”), red Lophelia pertusa (“rL”), red Madrepora oculata (“rM”); 3) ZONE (1 m–10 m): ridge top with coral terraces (“crest”), ridge slope with single coral colonies on rubble (“slope”), ridge depression with single colonies on clay (“valley”); 4) IN-OUT (1 m–10 m–100 m): reef center (“reef-in”), reef periphery in distances of 1, 10, 100 m away from the apparent reef margin (“reef-out”); 5) REEF (km): Røst Reef (“Røst”), Trænadjupet Reef (“Trænadjupet”), Tisler Reef (“Tisler”), Langenuen Fjord (“Langenuen”).

