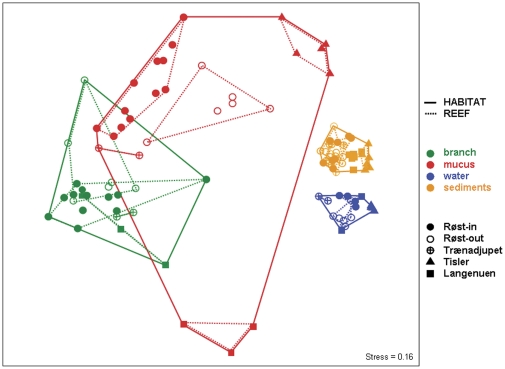
Figure 5. NMDS ordination of all ARISA community profiles.
For each sample, consensus signals of PCR triplicates were used. Objects represent consensus signals for all PCR triplicates per sample and share a more similar community structure when plotting closer to each other (Bray-Curtis distance). A posteriori groupings specify microbial habitat type and reef site. The low stress value indicates appropriate representation of the original Bray-Curtis dissimilarity matrix into a 2-dimensional space.

