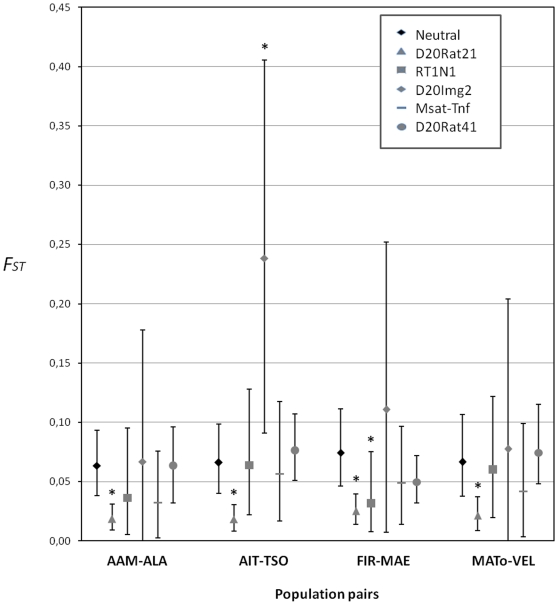
Figure 2. Comparison of pairwise population differentiation levels (FST) between the five MHC-linked microsatellites and the neutral loci for the Madagascar's dataset.
The points correspond to the mean FST obtained over 1000 bootstrap and the error bars to the 95% confidence intervals (determined .from the 25th and 975th value in the ranked list of 1000 bootstrap FST values). The neutral values are estimates from the global dataset of 13 presumed-neutral microsatellites. * indicate the MHC-linked markers significantly differing from neutral microsatellites for FST estimates.

