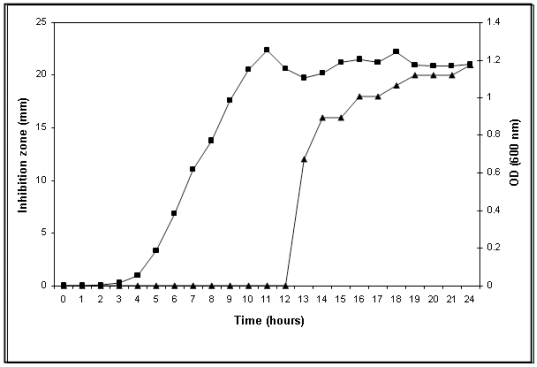
Figure 1. Comparison of bacteriocin production at different phases of growth curve.
The growth curve analysis of strain Brevibacillus sp. GI-9 indicates that the production of bacteriocin initiated at late logarithmic phase. Growth measured as absorption at 600 nm is indicated by squares (left y axes), while the bacteriocin activity by triangles (right y axes).

