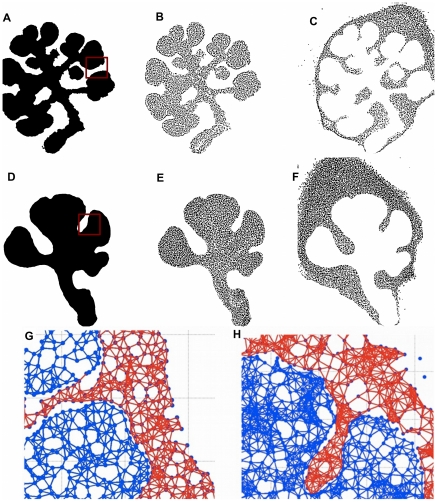
Figure 2. Generation of Cell Graphs.
Stitched images were segmented using the active contour method to define epithelial (white) vs mesenchymal tissue (black) in control (a) and ROCK inhibitor-treated explants (d). These masks were used to identify the epithelial nuclei (b, e) and mesenchymal nuclei (c, f). Using each nucleus as a vertex, cell-graphs were constructed for control and ROCK inhibitor-treated tissues, respectively (g, h), where zoomed regions of cell graphs corresponding to regions of the original images (shown as red boxes in a and d) are shown in detail. Epithelial tissue is respresented by the blue graph and the mesenchymal tissue is represented by the red graph. We discarded the sublingual tissues and only used the submandibilar gland, (Figure S2).

