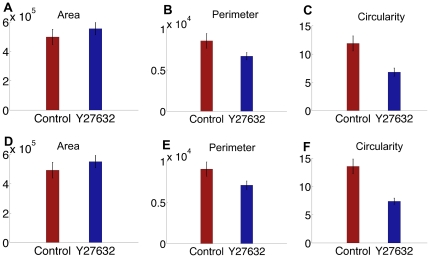
Figure 3. Direct validations of cell-graph features using standard image analysis methods.
Plots of (a) area, (b) perimeter and (c) circularity from images using conventional image analysis methods and plots of cell-graph-derived raw data pertaining to (d) area, (e) perimeter and (f) circularity are shown. Control refers to untreated epithelium and Y27632 refers to the ROCK inhibitor treatment. The same trends for control vs ROCK inhibitor treatment were observed for the features obtained using image analysis and cell-graphs. The percent differences between the conventional image analysis and our image segmentation technique are found to be 1.16% and 0.73% for the area; 5.66% and 5.94% for the perimeter; 11.0532 and 16.1463 for the circularity of the control and ROCK inhibitor-treated samples, respectively.

