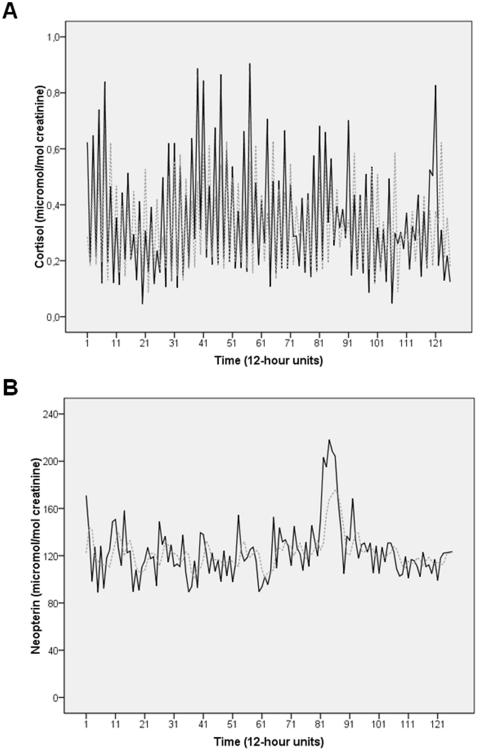
Figure 1. Time series of urinary cortisol and urinary neopterin levels of the healthy woman under study.
A) shows the time series of urinary cortisol levels, and B) shows the time series of urinary neopterin levels. Both the raw data (solid black) and the fit from the ARIMA model representing the series' internal structure (dotted grey) are plotted. Time series cover a period of 63 days or 126 12-hour time-units during which the subject collected her entire urine in day portions (08:00–20:00 h, uneven numbers) and night portions (20:00–08:00 h, even numbers).

