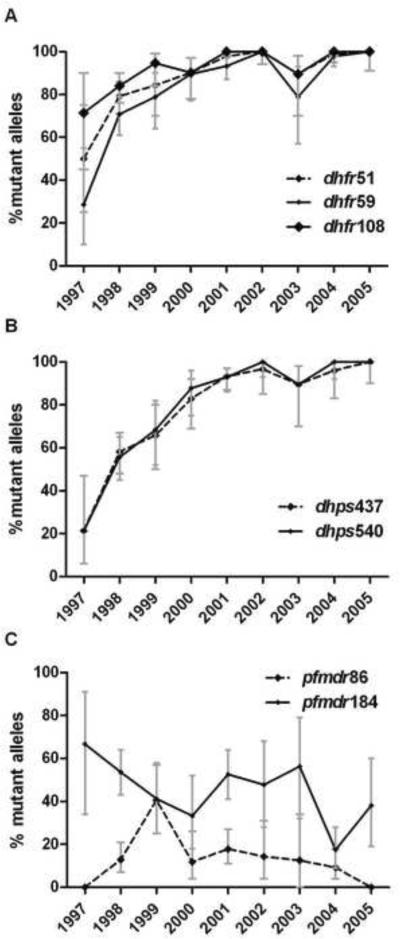
Figure 2. Frequency of mutant dhfr (A), dhps (B), and pfmdr1 (C) alleles by year.
Points are frequencies, bars are 95% confidence intervals.
Allele frequencies were generated from allele prevalences using MalHaploFreq (Hastings and Smith 2008), which uses maximum likelihood analysis to estimate genotype frequencies based upon genotype prevalence and the multiplicity of parasite clones.

