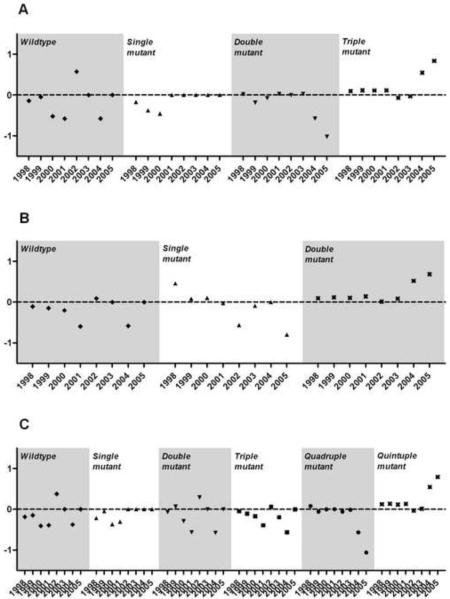
Figure 5. Annual selection coefficients on dhfr (A), dhps (B) and combined dhfr-dhps (C) haplotypes.
Plotted points are point estimates.
Plotted points are the slope of a regression line fitted to a plot of the ln(R/S) plotted against parasite generations (assumed 6/year), where R is the frequency of the mutant haplotype indicated, and S is the frequency of other haplotypes. Annual selection coefficients were calculated as the slope of the line fitted to the ln(R/S) for the year of interest and the preceding and subsequent years. Values greater than zero represent a haplotype survival advantage in subsequent parasite generations; those less than zero indicate a survival disadvantage.

