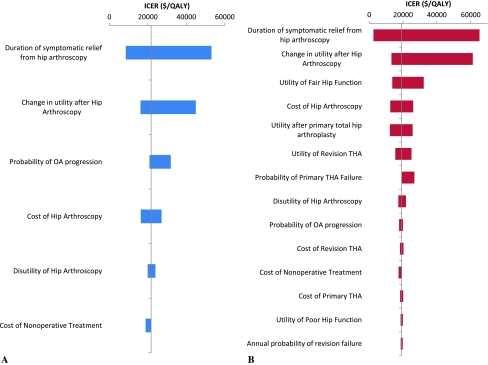
Fig. 7A–B.
Tornado diagrams show the range of incremental cost-effectiveness ratios resulting from one-way sensitivity analysis of multiple variables on the same scale for the case of (A) no arthritis at baseline and (B) arthritis at baseline. Variables that resulted in a range of less than $1000/quality-adjusted life-year were not included. ICER = incremental cost-effectiveness ratio; QALY = quality-adjusted life-year.

