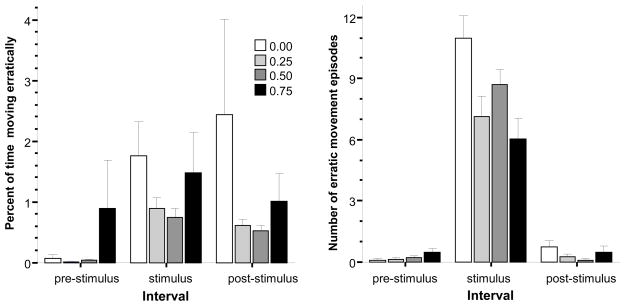
Fig 7.
The percent of time (left graph) and frequency (right graph) of erratic movement (zig-zagging) exhibited during the pre-stimulus, stimulus presentation, and post-stimulus periods. Mean ± S.E.M. are shown. Note that during the pre-stimulus period, the first interval, no stimulus was shown, during the stimulus period a moving black bird silhouette was presented multiple times, and during the post-stimulus period again no stimulus was presented. The shading of the bars corresponds to the alcohol dose used with darker shades indicating higher concentrations (see legends). For details of the results of statistical analyses see Results.

